Insurance Cost Benchmarks for Delivery Contractor Fleets
Delivery fleets face sharply rising premiums as carriers struggle with claim losses.

Delivery fleets pay more for insurance than almost any other commercial vehicle category, and nobody in this business finds that surprising. Frequent stops, dense traffic, tight windows, high mileage, cargo sitting exposed in the back: insurers price every one of those separately, then let them stack. A landscaping company doesn't see this pricing tier, and neither does a plumbing outfit. Commercial auto liability posted a combined ratio of 113 in 2024, according to CBIZ, which means insurers paid out more in claims than they took in, and that number explains almost everything else in this piece: rates keep rising because the math hasn't worked for carriers in years, and nobody's found a fix.
A delivery contractor fleet of five or more vehicles runs $1,800 to $2,500 per vehicle per year for full coverage, based on current market benchmarks. Smaller fleets of five to ten vehicles typically spend $6,000 to $20,000 annually in total, which works out to roughly $100 to $200 per vehicle per month, with metro operations and higher-risk delivery work landing at the top of that band. For fleets carrying a $1 million liability policy, the Independent Insurance Agents and Brokers of America puts 2025 pricing at $2,400 to $4,800 per vehicle annually. These are ranges, not quotes, and anyone buying coverage without going through underwriting is working from an estimate, not a number.
A standard delivery fleet of five or more vehicles runs $1,800 to $2,500 per vehicle, per year, for full coverage. Break that into monthly terms and light-duty fleets carrying liability plus physical damage land around $150 to $450 a vehicle; heavier trucks or higher-liability delivery work push it to $300, sometimes $900 a month.
Progressive Commercial's 2025 national averages show the spread inside that range: $260 a month for contractor autos, up to $926 a month for for-hire transport trucks. Same broad category, split hard by vehicle class and risk.
Smaller operations, five to ten vehicles, typically spend $6,000 to $20,000 a year total, or roughly $100 to $200 per vehicle per month, with metro operations and higher-risk delivery work landing at the top of that band. The Independent Insurance Agents and Brokers of America puts 2025 pricing for a $1 million liability policy at $2,400 to $4,800 per vehicle annually for a small fleet, and transportation and logistics operations often clear $300 a month per vehicle once mileage, cargo value, and DOT compliance costs get factored in.
These are ranges, not quotes. You won't get an exact number without underwriting, and anyone who tells you otherwise is guessing. Treat them as a floor.
How does fleet size change what you pay for delivery contractor insurance?
Small fleets under five vehicles get hammered on per-unit pricing, since there's no volume, no leverage, and no fleet policy to lean on. The insurer prices each vehicle like it's the only risk in the room, because as far as the underwriter's concerned, it is.
Cross five vehicles and the whole calculation shifts. Fleet policies open up, pricing becomes negotiable, and per-unit cost drops because the insurer is now underwriting a portfolio instead of one car sitting alone. Keep scaling past that and bulk purchasing kicks in, the same logic that makes group health insurance cheaper per head than an individual plan, and spread the risk wide enough and the price per unit falls.
An operator buying coverage one vehicle at a time and an operator running a hundred-driver contractor network aren't shopping in the same market, and they're not even close. Carriers that specialize in fleet business routinely decline very small fleets outright, because the account isn't worth the underwriting effort on its own. Fleet size moves the number and decides who'll even quote you.
How vehicle type reshapes the premium — vans, Sprinters, box trucks, and EVs
Vehicle class sets the floor and the ceiling. Contractor sedans and cargo vans sit at the bottom of the range, while Sprinter vans and other last-mile delivery vehicles land in the middle, priced against stop volume and cargo value. Box trucks and straight trucks push toward the top, and depending on weight class, they trigger DOT filing requirements that shrink the pool of insurers willing to write the policy at all.
For-hire transport trucks sit at the ceiling. Progressive's $926-a-month average for that category is the benchmark the rest of the market gets measured against.
EVs throw a wrench into all of this, and most fleet operators haven't priced it in yet. Commercial EVs cost 20% to 40% more to insure than gas or diesel equivalents right now, because carriers are underwriting for damage severity as much as accident frequency. A fender-bender that dents a gas van's bumper can total an EV's battery pack, and a compromised pack usually means a total loss, not a repair bill. Anyone running the fuel-savings math on an EV switch needs to run the insurance math right alongside it, because those two lines move in opposite directions.
Physical damage coverage jumped 14.9% in 2024, the biggest single-year increase across all major commercial lines, and vehicle replacement value matters more to your premium today than it did two years ago.
The rate environment operators are entering in 2025–2026
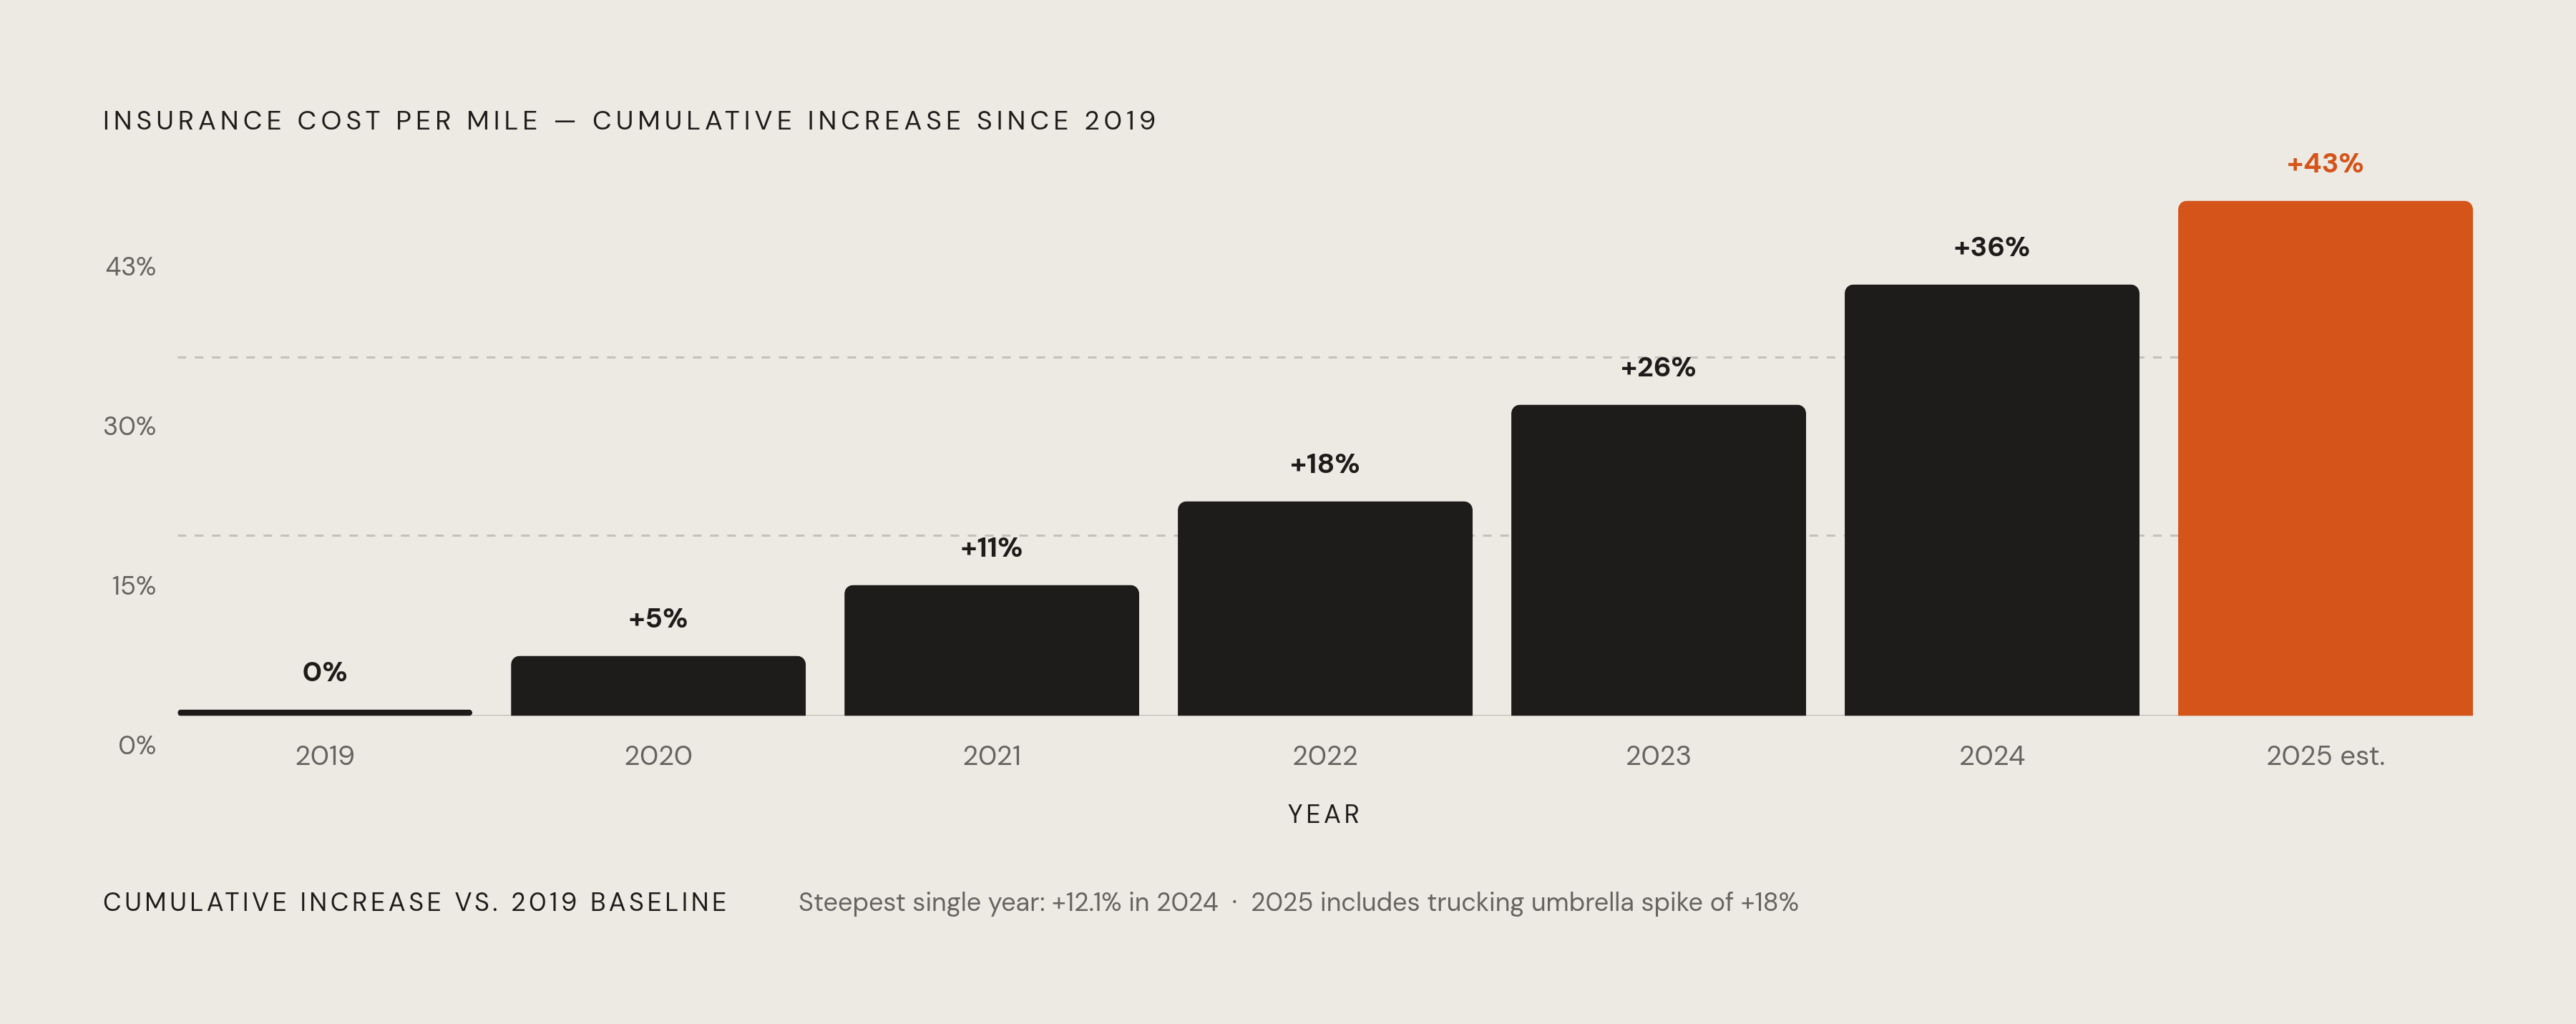
Net written premiums for commercial auto rose 10.7% industry-wide in 2024, and the projection for 2025 sits at another 10.8%. Insurance cost per mile climbed an estimated 43% from 2019 to 2025, with the steepest single-year jump, 12.1%, landing in 2024. Trucking fleet umbrella rates spiked 18% in 2025 alone; casualty and commercial auto rates overall rose 9%.
The real driver behind all of it has a name in the industry: the nuclear verdict, a jury award north of $10 million. There were 135 of them against corporations in 2024, and trucking companies show up among the most frequent defendants, a 52% jump from the prior year. That's the mechanism that turns a routine fender-bender into an eight-figure liability event. Insurers don't need your accident record to get worse to justify a rate hike; they just need one jury, in one county, to hand down one number big enough to reprice the entire book.
Analysts expect another 5% to 15% increase heading into 2025 and 2026. Geography stacks on top: the gap between the cheapest and most expensive state markets runs past 90%, with Florida, Louisiana, New York, and New Jersey sitting at the expensive end. A benchmark from two years ago is stale already, so check your numbers every year, not just at renewal.
Cargo coverage gaps that delivery operators consistently miss
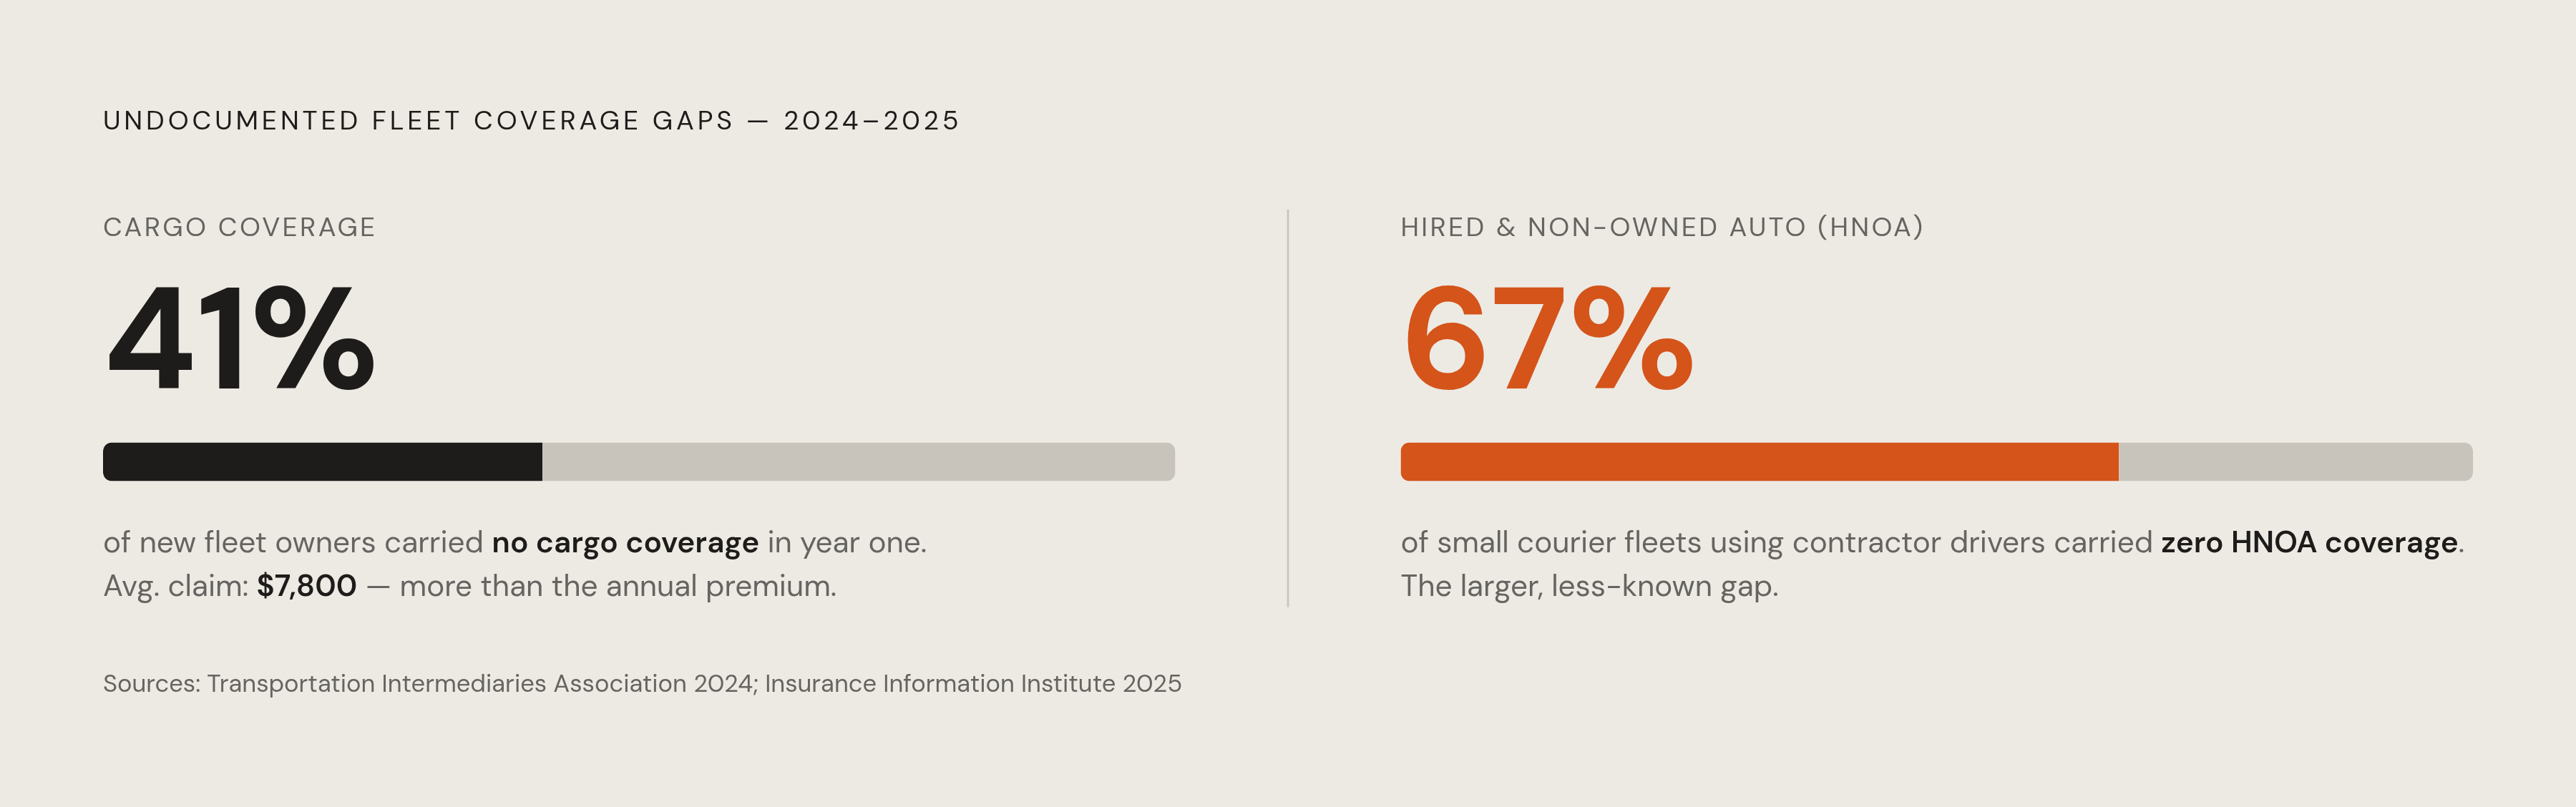
The Transportation Intermediaries Association found in a 2024 report that 41% of new fleet owners carried no cargo coverage on their first contract, and the average cargo claim in that first year ran $7,800, more than the annual premium would have cost. General freight cargo insurance runs $0.40 to $1.20 per $100 of declared value per month, more for high-value or temperature-sensitive freight. That math isn't close: the premium is small and predictable, and the claim isn't.
Hired and non-owned auto coverage, HNOA, is the gap most operators don't know exists until it's too late to matter. A standard business auto policy covers vehicles the company owns; it says nothing about a contractor's personal car. The second an independent contractor delivers in their own vehicle, the company is carrying liability with no policy behind it. A 2025 Insurance Information Institute analysis found 67% of small courier fleets using contractor drivers carried zero HNOA coverage. It closes the gap cheaply, but only if someone remembers to ask for it.
The third gap is dumber, honestly, and it still catches people every year: running a personal auto policy on a business vehicle. Most personal policies carry a business-use exclusion, so coverage voids the moment the vehicle gets used for hire. New operators trip over this constantly, and they usually find out right after a claim gets denied, which is the worst possible time to learn anything.
None of these gaps stay contained to insurance, either. They show up in contractor agreements and client contracts as compliance failures, and by the time anyone notices, the bill's already arrived.
Occupational accident insurance: the benchmark for 1099 contractor coverage
Independent contractors don't qualify for workers' comp. Occupational accident insurance, OAI, fills that hole, built on a different pricing logic: instead of a flat rate tied to payroll, you can price it by hours worked, miles driven, or deliveries completed.
Workers' comp for delivery drivers averages $6.33 per $100 of payroll in 2025, and for a driver earning $4,000 a month, that's roughly $296 a month. OAI for a comparable contractor comes in well under that number, and it skips the state-mandated schedule in favor of flexible benefit structures. Price it per mile, per delivery, per hour, whatever fits, which matters a lot when your contractor pool ranges from someone driving four hours a week to someone driving forty.
The regulatory floor is rising too. Several states are moving to extend coverage requirements to contractor drivers, and the trend is picking up speed. For IC-model delivery operators, broader OAI adoption looks increasingly likely, ready or not. It carries weight beyond the cost line, too. It affects contractor retention, it affects contractor welfare, and it sits directly upstream of the misclassification risk in the next section.
How contractor classification affects what insurance you owe and what you're exposed to if you get it wrong
W-2 or 1099 decides the entire insurance structure an operator has to carry. W-2 status makes workers' comp mandatory, full cost, full statutory obligation, no way around it. 1099 status makes OAI optional at the federal level, though several states are closing that gap fast, and the cost structure looks nothing like workers' comp.
The classification question itself is a moving target right now. The federal standard for contractor classification has shifted in recent years, and state standards vary widely on top of that federal uncertainty, with some running far stricter than whatever the baseline happens to be this year.
Misclassify a worker and the savings stop mattering fast. State civil penalties per violation can be substantial. Add back-owed workers' comp premiums for the misclassified period, plus direct liability for any workplace injury OAI would have covered had the classification been right, and total exposure per worker can climb well into five or six figures before a single legal fee shows up. Federal enforcement actions tied to misclassification have resulted in substantial back-wage recoveries in recent years.
None of this is abstract in 2025. Major gig-economy companies have faced costly class-action settlements and state enforcement actions over driver misclassification in recent years. Cut insurance costs by leaning on contractor classification without doing the compliance work behind it, and you're taking out a loan against a much bigger bill, due later, with worse terms.
Where operators are most likely overpaying and where they're underinsured
Overpaying shows up in the same few spots, over and over. Buying insurance vehicle by vehicle instead of through a fleet or bulk program is the most common one, and carrying coverage levels inherited from a previous business, never reassessed against current risk, is another. Getting quoted at a higher-risk territory's rate while actually operating somewhere cheaper happens more than people admit. And plenty of genuinely IC-structured operators pay for workers' comp-equivalent coverage when OAI would do the same job for less, paying premium prices for the wrong product entirely.
Underinsurance clusters just as predictably. No cargo coverage in year one, the 41% gap the Transportation Intermediaries Association documented, and no HNOA when contractors drive their own cars, the 67% gap the Insurance Information Institute found. No OAI for contractor drivers, which stacks welfare exposure on top of misclassification liability at the same time. Coverage limits set back when the fleet was smaller or rates were lower, never revisited even as per-mile costs climbed 43% since 2019.
Here's the part that catches people off guard: overpaying and underinsuring usually happen in the same fleet, at the same time. Too much money goes toward the wrong coverage, too little goes toward the coverage that actually protects the business. Insurers price for what they can't verify, so an operator who can show active credentialing, a clean safety record, and consistent contractor-status upkeep walks into renewal with real leverage. That leverage is built one clean audit trail at a time, and it's the only real lever left once the rate environment stops cooperating.